Compatible
Import data from Columbus Instruments CLAMS, Sable Promethion, and TSE PhenoMaster.
Visualization
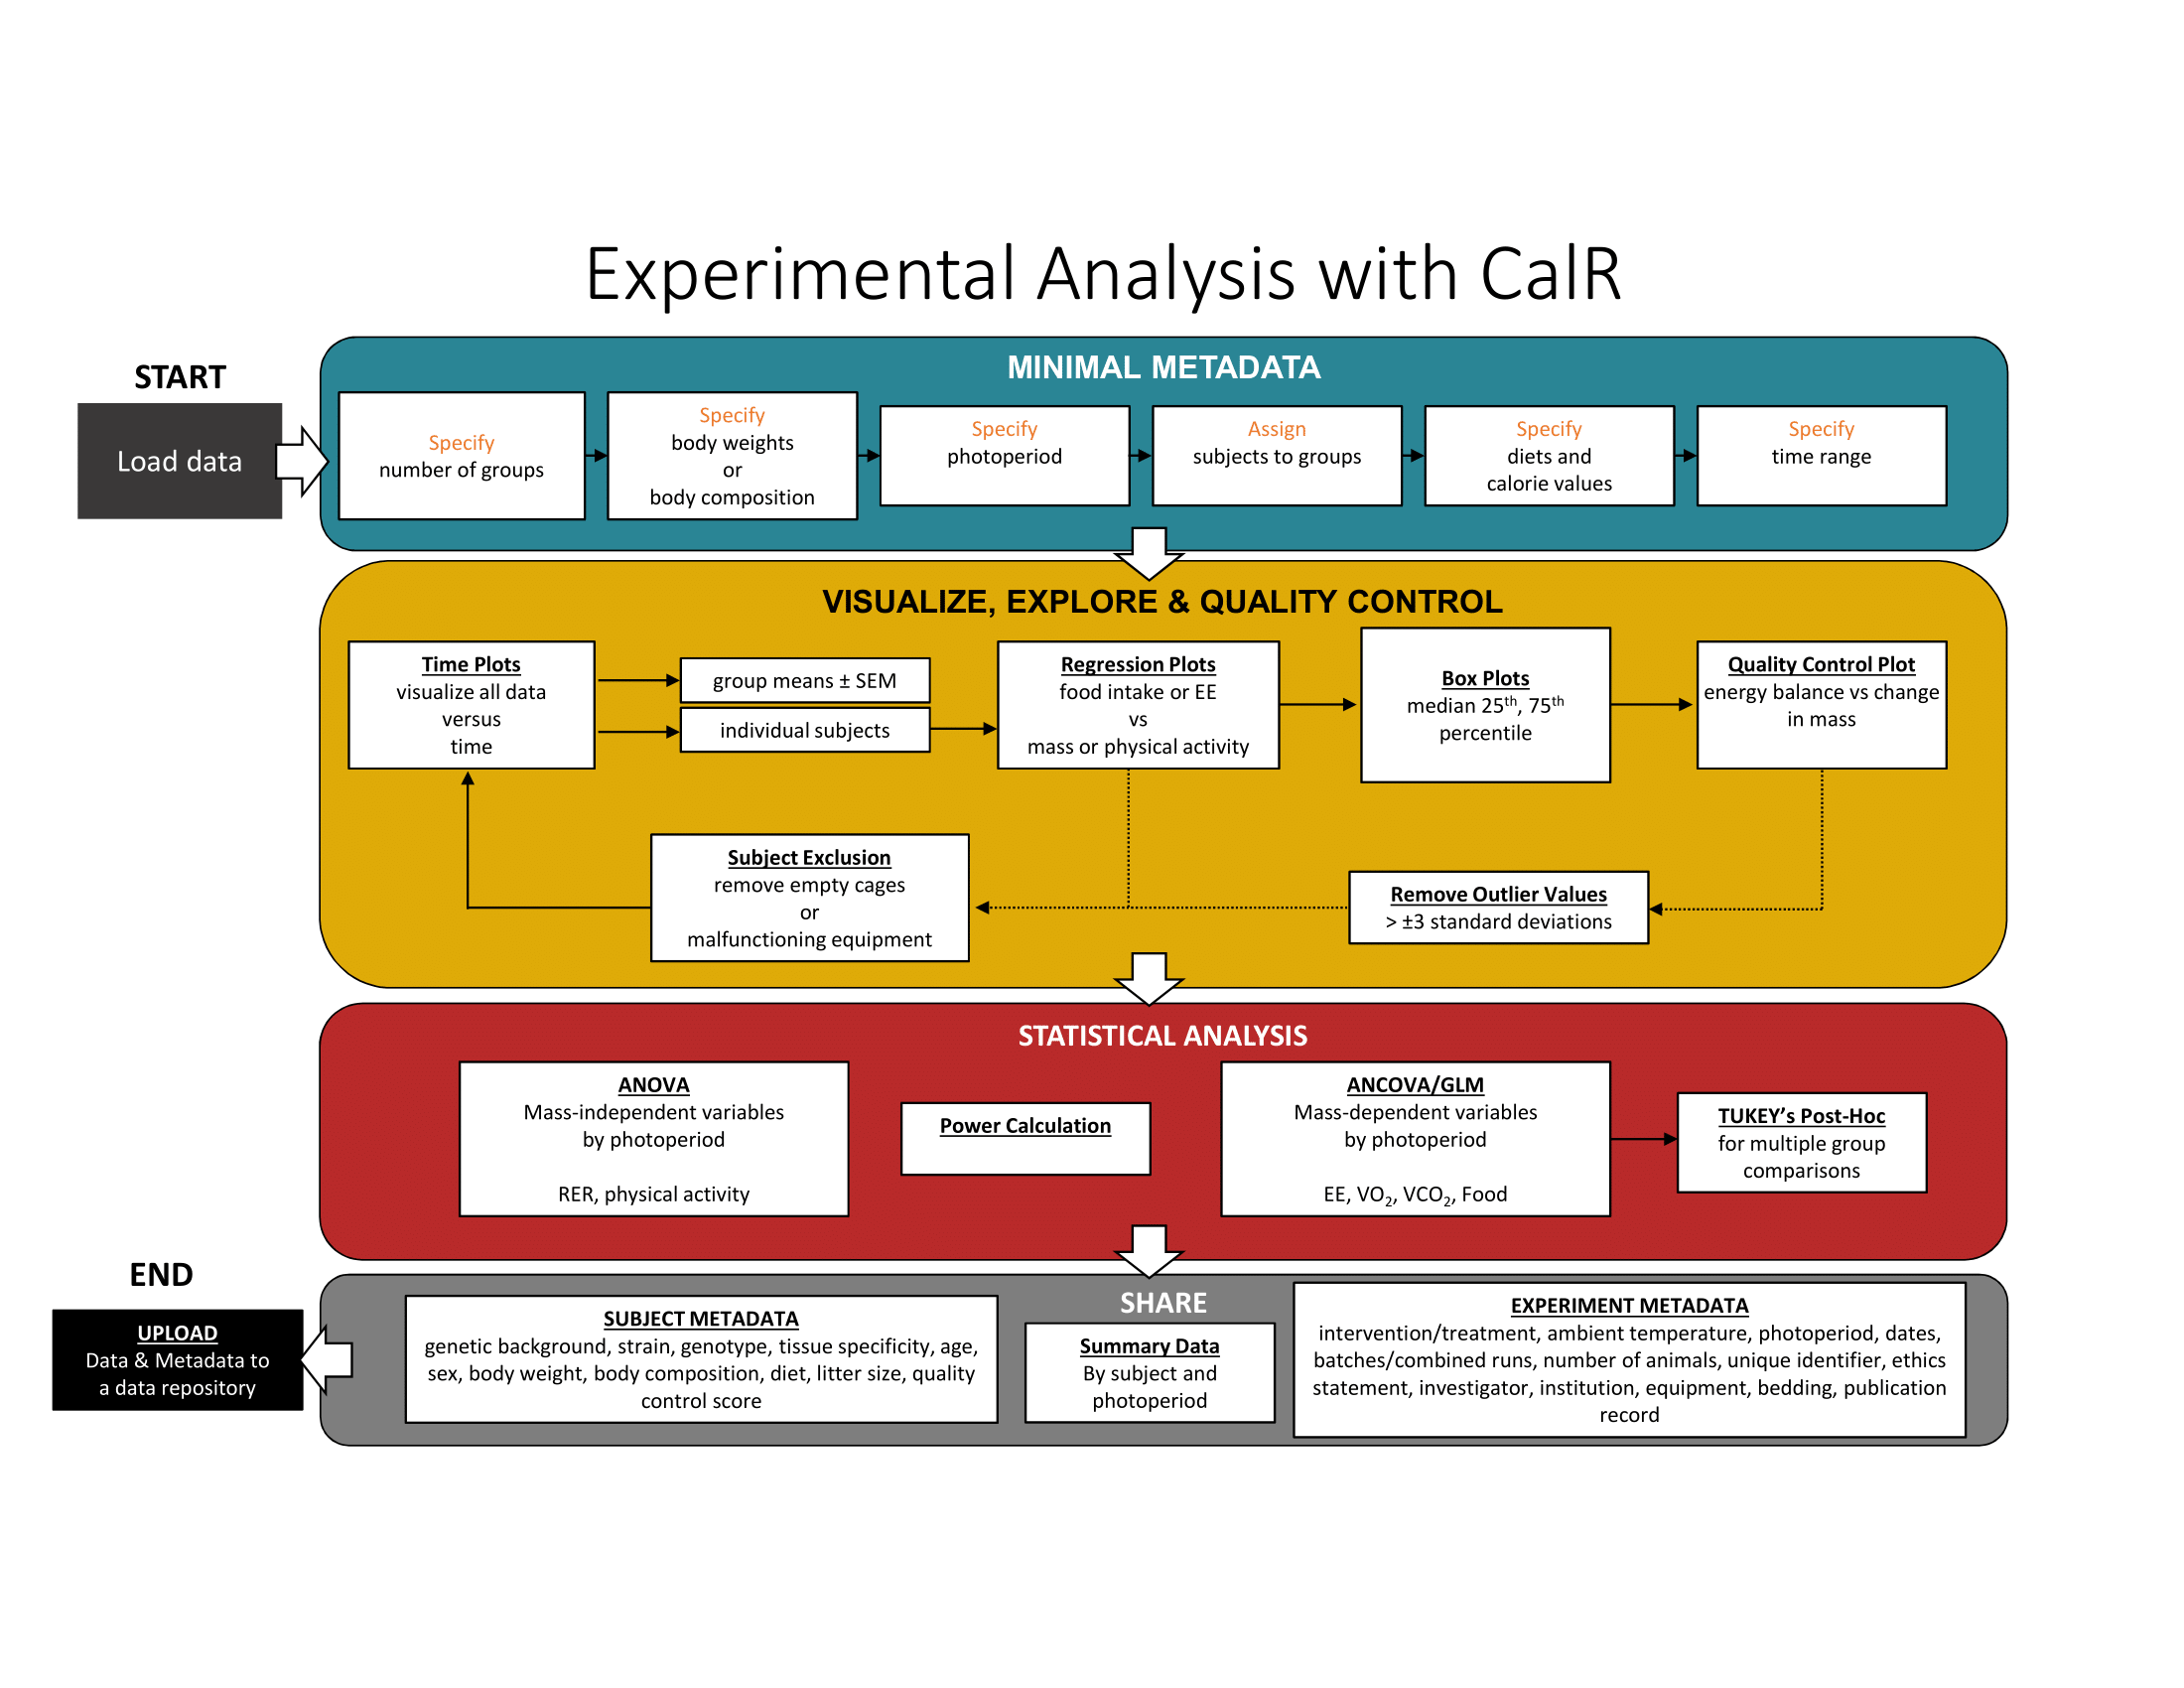
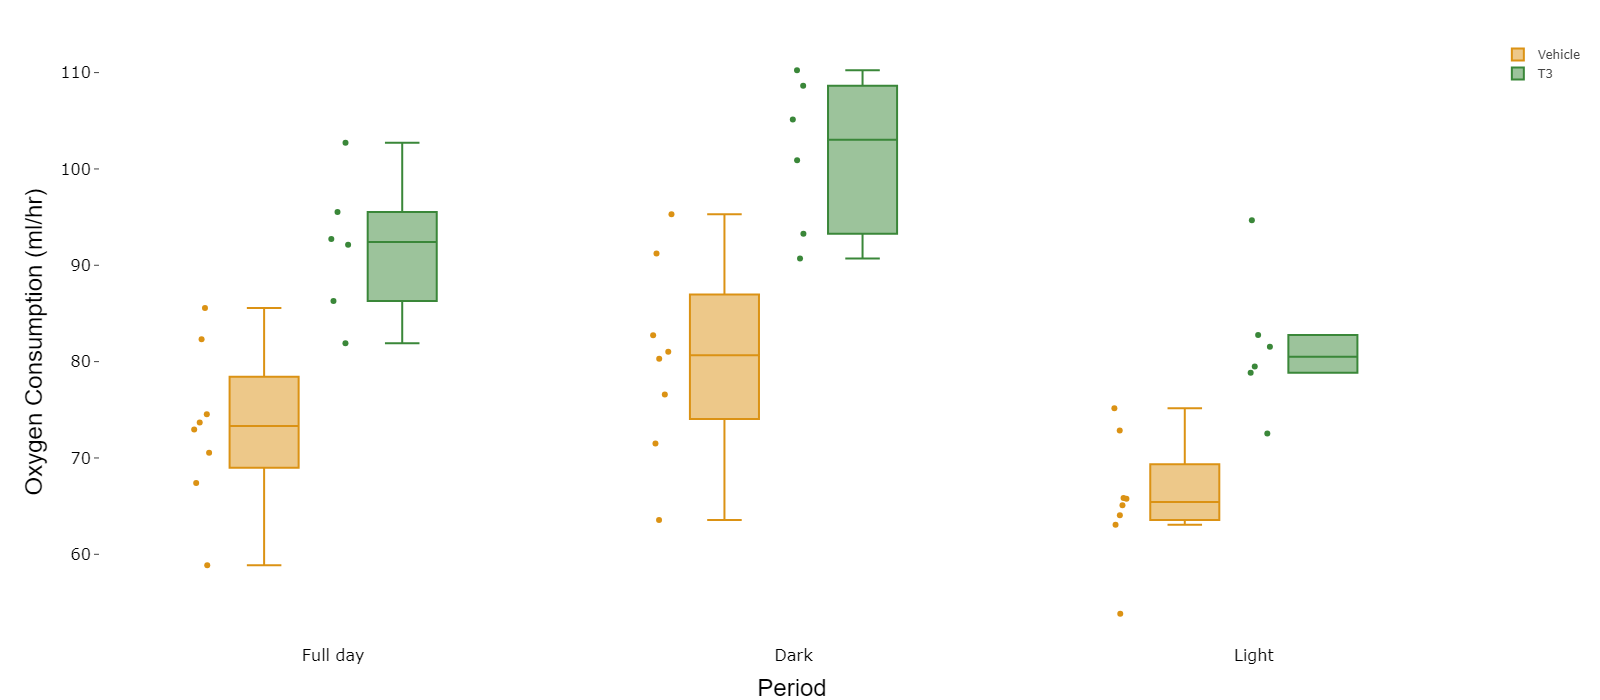
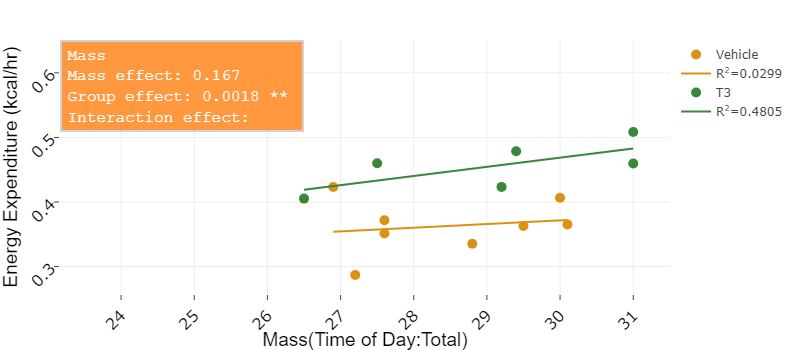
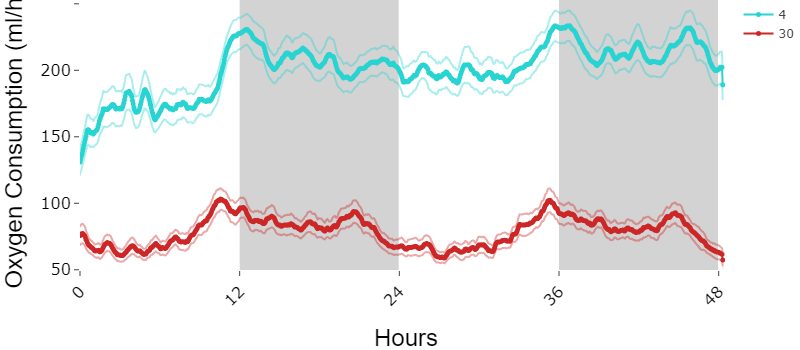
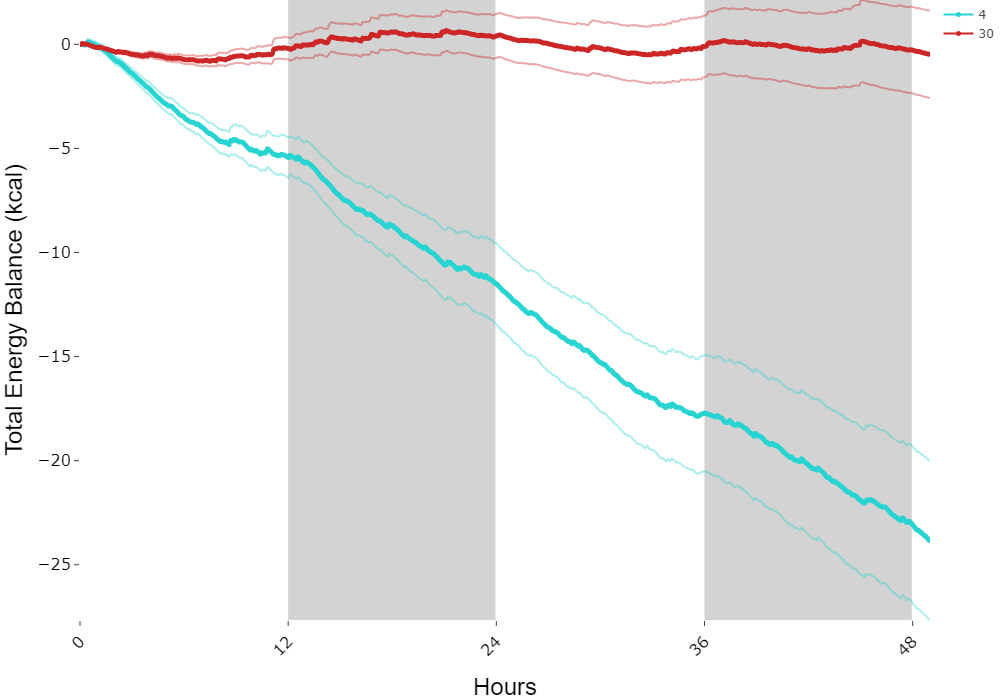
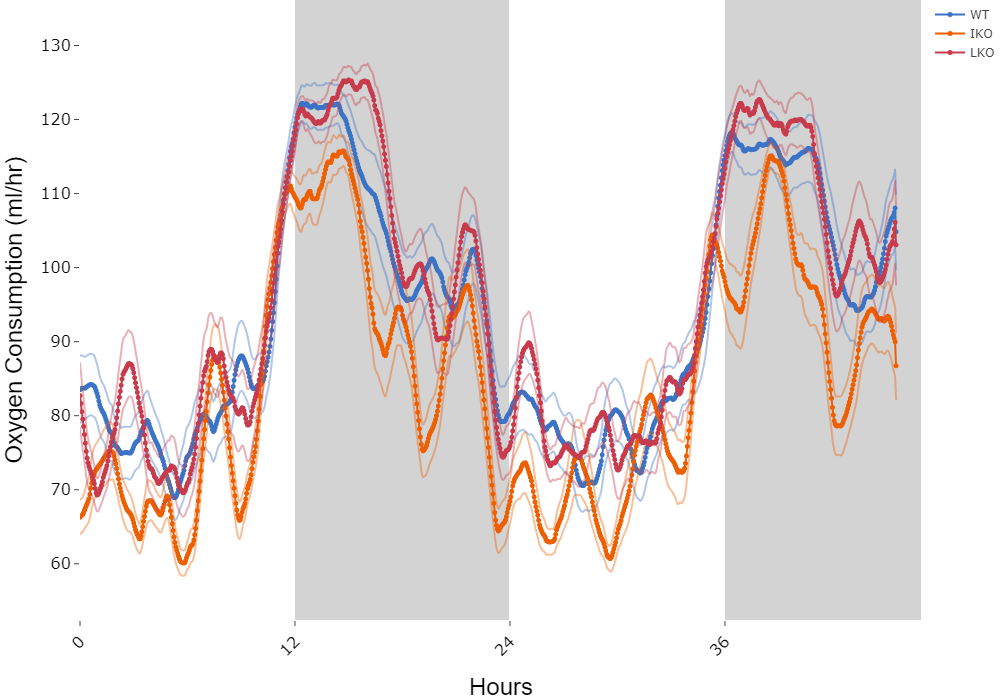
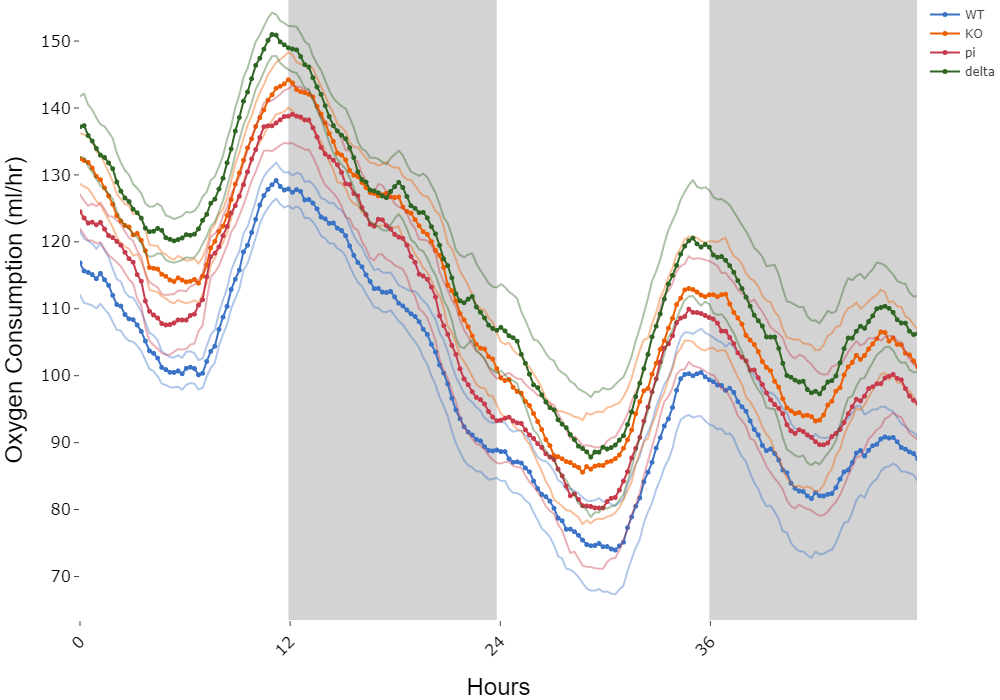
Generate customizable time plots, box plots, cumulative energy balance plots, and regression-based analyses from a single workflow.
Features
CalR2 standardizes common indirect calorimetry workflows while keeping user choices and exclusions exportable.
Import data from Columbus Instruments CLAMS, Sable Promethion, and TSE PhenoMaster.
Produce a full analysis after importing raw data, assigning groups, and selecting a time frame.
Adjust plot colors, text size, line width, and export settings before downloading results.
Use regression-based models that account for body mass as a covariate.
Export key analysis details, including excluded data, session settings, and user workflows.
Support unique experimental designs through a flexible template-based framework.